Custom formatting of date and time for events in in Squarespace blocks

I’ve recently done a little bit of front-end development work on a Squarespace website.  This is my first experience with the platform, and it’s been generally positive.  It starts out with a sane content model and makes all the content available as JSON.

The system provides a number of predefined blocks that let you expose content from  collections on other pages in the site.  Unfortunately, as of January 2014, you can’t customize the markup of items in a block.

This was a problem for us because the default summary block for event content only showed the event date and we wanted to also show the start time.  Luckily, the JSON feed of the events collection provided timestamps for the start and end date/time.

I wrote Squarespace Event List, a YUI3 plugin that fetches the event collection JSON with AJAX and overwrites a block’s content with a custom-formatted event list.  You can find the JavaScript and some brief documentation on GitHub.


Floodlight

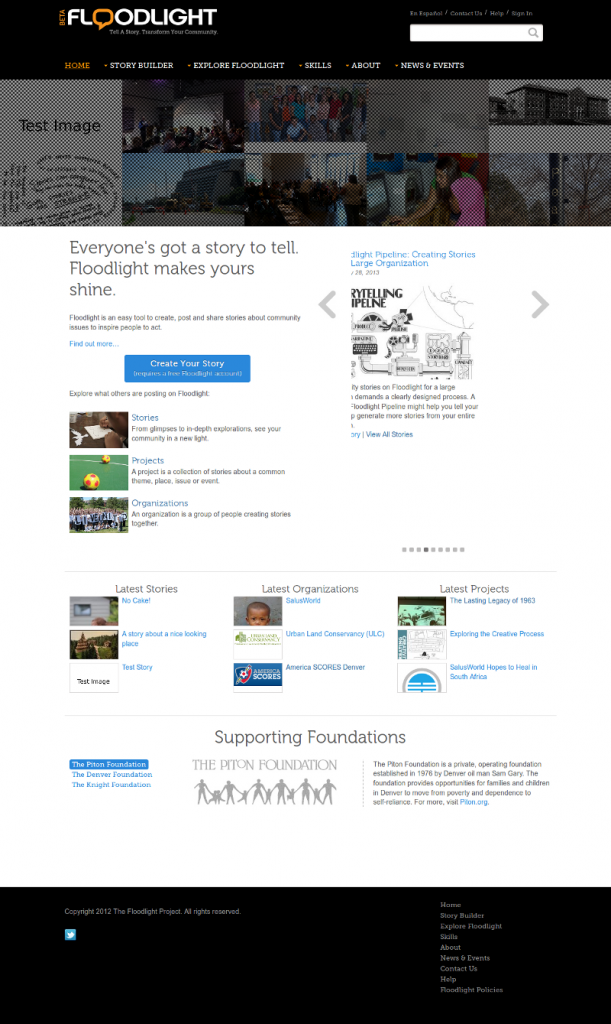
Floodlight is a web-based platform for telling community stories from people, places and organizations around the Denver metropolitan area.  The project was originally supported by The Piton Foundation and funded in part by a grant received as part of the Knight Foundation Community Information Challenge.

Role

Lead developer

Details

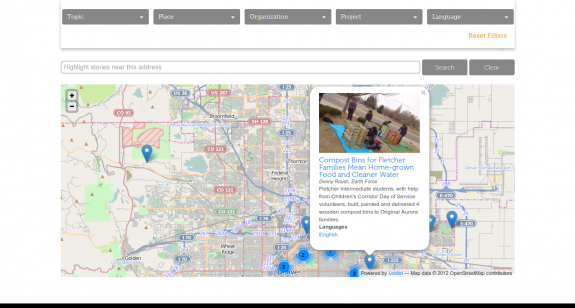
Since many of the stories told on Floodlight are about work being done in particular Denver, Colorado neighborhoods, authors needed to be able to tag their stories with boundary geographies (cities, neighborhoods, zip codes) or provide addresses of specific places, which are automatically geocoded and associated with boundary geographies.

For this project, I relied on the excellent spatial data support of the PostGIS database and abstractions offered by the Django Frameworks ORM to implement a data model and create scripts to easily load new boundary geographies from shapefiles and define their relationships with other boundaries.

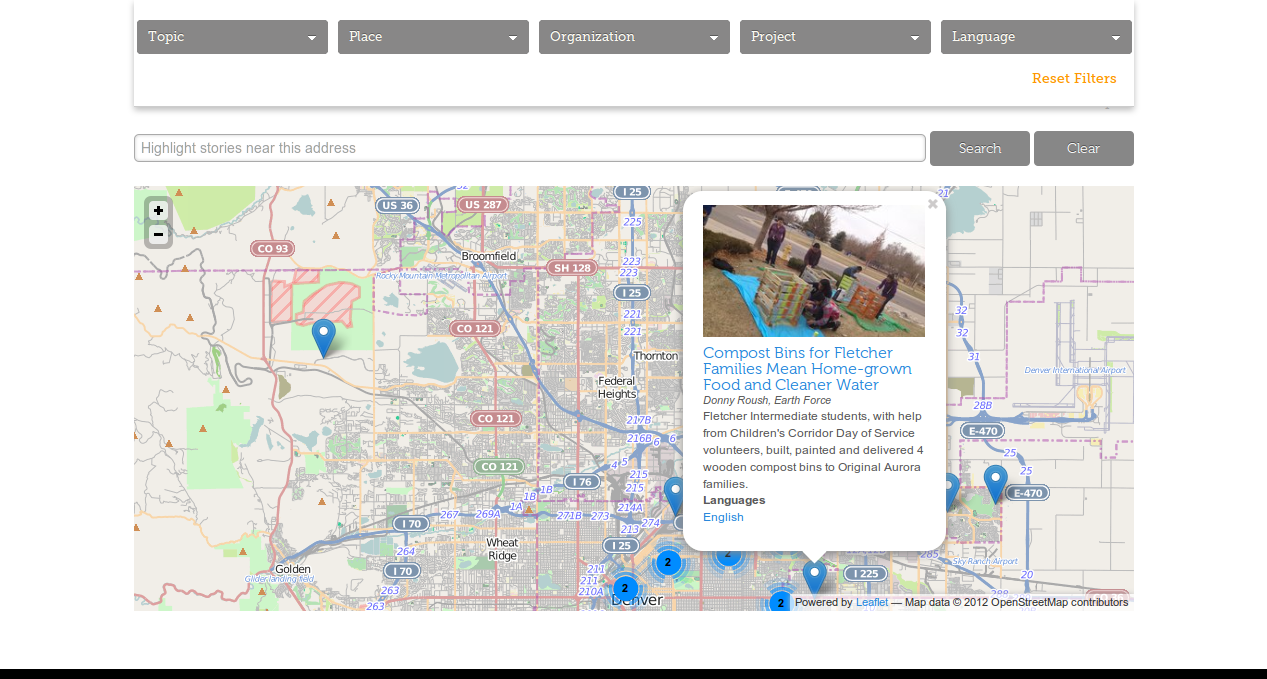
Users searching for stories in their community can use a faceted browsing interface that not only filters based on address and boundary geography, but also other taxonomies.  In order to integrate these different types of filters, I used the Solr search server.  On the front end, the Backbone framework provides an interface to the faceted browse and the Leaflet mapping library is used to display boundary geographies and story markers based on the user’s filters.

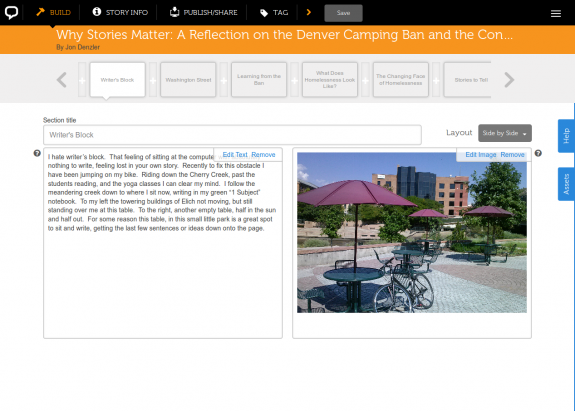
The application is powered by a RESTful API that is consumed by a Backbone-based story builder.

In addition to the web platform, the project also included a great capacity-building component.  Team members conducted “story raising” events that trained community members in different digital storytelling skills and a “story navigator” worked with community groups to discover and tell stories using the platform.

More Information

Screenshots

Home_Floodlight_-_2014-01-15_22.07.30

Explore_Floodlight_Floodlight_-_2014-01-15_22.11.14

Floodlight_Why_Stories_Matter_A_Reflection_on_the_Denver_Camping_Ban_and_the_Conversation_around_Homelessness_-_2014-01-15_22.14.54

MoveSmart

Home_MoveSmart_St._Louis_(Dev)_-_2014-01-15_22.41.50

MoveSmart helped users discover new, affordable, neighborhoods based on neighborhood assets like quality public schools, walkability and farmers markets.

Role

Sustaining developer

Description

I didn’t build the original MoveSmart, but I learned a ton maintaining Bec White‘s code. Building on a clever API that leveraged Drupal Views, I created custom  modules to add new datasets to the system and to support neighborhoods in the St. Louis metropolitan area.

In addition to continued development of the system, I performed data cleaning and merging of the datasets used in the neighborhood search.

More information

Draw the Line Midwest

Open source mapping software allowed users to view state and federal legislative districts and draw their own district plans during the 2010 redistricting process.

Role

Integrating developer

Details

I deployed and customized instances of the open source District Builder software for a number of Midwestern states.  Users could view existing districts or create new district maps based on block and tract census geographies.  Some instances provided a platform for competitions to see if users could create more balanced district plans based on political, racial and population demographics.

In order to minimize hosting costs, the instances were deployed on a single server with resources provisioned to virtual hosts using VMWare.  In addition to the provisioning and hosting, I provided data preprocessing and cleaning in order to add additional demographic data to use to evaluate district plans.