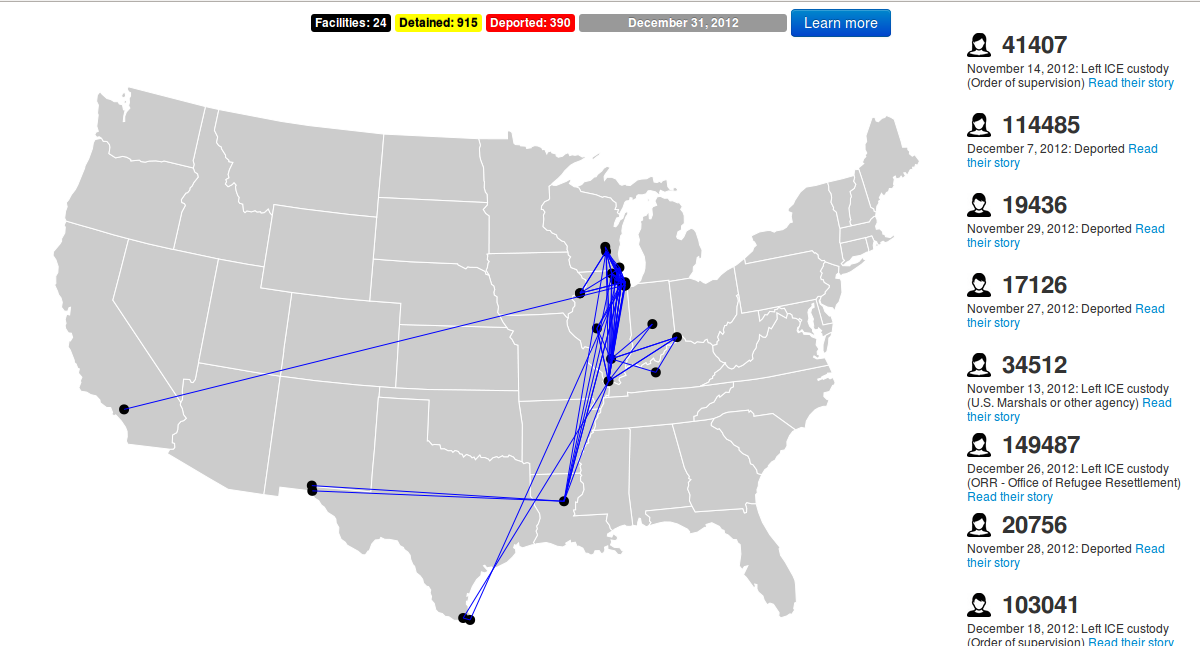
Illinois in the ICE Age is a data visualization project that I made along with Jimmie Glover, Ruth Lopez and @taratc for Chicago MigraHack. The visualization is based on a data set provided by the Transactional Records Access Clearinghouse that describes the trajectory of 915 migrants detained in Illinois from the time they were taken into custody until they left ICE custody in November and December 2012.
We used Google Spreadsheets’ pivot tables feature to explore the data and develop questions and insights. This also provided a good way to double check programatically computed statistics. The map animation is built using D3. I sucked the data set into a local SQLite database using the Peewee ORM and wrote some Python scripts to transform the data and export it as JSON to make it easier to visualize (especially the day-by-day updates).
The project won the “Best data visualization team project” and “Audience Favorite” awards.