boxcarbooks.org, bloomingtonarts.info, http://events.publicbroadcasting.net/wfiu/events.eventsmain, http://www.visitbloomington.com/calendar/, and http://events.iu.edu/webevent.cgi?cmd=opencal&cal=cal3
maps, population growth, web art project
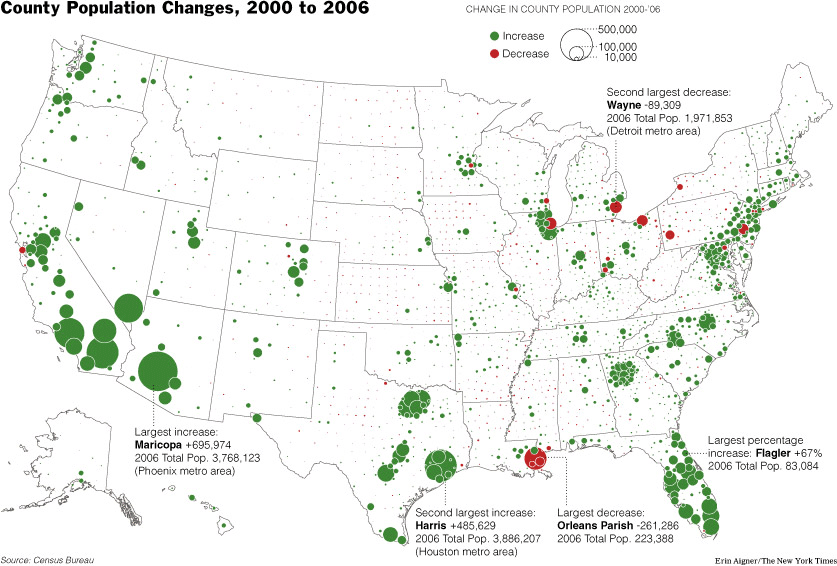
Update 2010-10-17: It seems like a lot of people come to this post looking for a blank map of the United States. I updated the link at the bottom of the page to point to a much better version from Wikimedia Commons. Download a SVG/PNG blank map of the United States.

This map has been on my mind all week. It’s from a NYTimes article titled Census Reports Arizona County Still Has Biggest Growth (though the article isn’t just about AZ). It’s a map of relative population increases/decreases around the country. Looking at the map, I want to think in terms of cities or communities as winners or losers or to think about how different or disconnected cities across the country are from each other. But what if this initial perception continues to shape my attitudes, or my actions? What happens when this mentality moves from the individual to the cultural or plays out at a policy level? It seems pretty unimaginative or limiting. This made me think, is there a way of looking at the USA, taking into account factors other than population growth, or incomes, or all the usual metrics of cities and communities? Is there a way of thinking that would show New Orleans as a big green dot and Atlanta as a big red dot? Is there a representation of qualities of cities that would make both New Orleans and Atlanta have the same type of dot? Is the red/green dot dichotomy too limiting to begin with? Let’s make our own maps that maybe show the relative nature of the places we live, or know, or read about, or hear about from a different perspective, with different values or metrics, or with more imagination.
Here’s how:
- Download a copy of a blank map of the USA from here.
- Draw on the map with a program like photoshop or print it out and draw on it by hand.
- Your new map should be a representation of the relative nature of different places in the US using circles of different sizes and colors, but you can use additional graphics/symbols too.
- Email your map to map@terrorware.com (or email that address to make arrangements to send it via postal mail).
- I’ll post the maps to this site, we can talk about them, and maybe figure out something cool to do with all of them.
trainwreck riders, sass dragons, prizzy prizzy please, pretty hot @ ducks in a stack.
Info on bands:
I think most of them have records available at Sweet Hickory.
Boxcar Inventory Development Update: discount children’s books inventory report, title sorting
- Modified reports form and discount_inventory_list report so that there is now a report generated for discount books that have a subject of Childrens Books, Young Adult Fiction, and Young Adult Nonfiction. These books weren’t getting included in any reports. Note that all these subjects are shelved along with their corresponding non-discount sections.
- Modified the inventory_list and discount_inventory_list reports so that they sort by author and then by title.
making a 4up PDF
This is the command that I used to make a 4up (that would be four equally sized images on one page) layout on letter sized paper of a tabloid sized poster. I used the excellent Multivalent tool’s Impose feature.
C:\Documents and Settings\surplus\Desktop>java -Xms32m -Xmx256m -classpath “C:\Documents and Settings\surplus\Desktop\Multivalent20060102.jar” tool.pdf.Impose -nup 4 -dim 2×2 -paper letter -page 1,1,1,1 promposter.pdf
Update:
This is the command that I use on my notebook running Ubuntu Gutsy Gibbon:
/usr/lib/jvm/java-6-sun/bin/java -classpath /home/ghing/java/Multivalent.jar tool.pdf.Impose -nup 4 -dim 2x2 -paper letter -page 1,1,1,1 describe_yourself.pdf
justin rhody’s birthday
“fingers are intentional” an opening exhibition of photographs by justin clifford rhody @ sweet hickory. 7p.
 
“fingers are intentional”
an opening exhibition of photographs by justin clifford rhody
(taken through the lens’s’s of disposable cameras over the course of two years, the exhibit will feature work made all over the united states and canada. to see a glimpse of what may appear at the opening check out the shoddy website: www.justincliffordrhody.biz)
support
I got an email from a friend who was starting a MySpace group to try to make an informal network of people to help support each other through more serious physical/psychological illness. A few days ago, the Icarus Project, a grassroots mental health support network, came up in a conversation, and a few months ago, I did a training with the Community Justice and Mediation Center which provides resources for people in Bloomington to navigate through conflicts that they can’t work out by themselves. Lately, it seems like people around me have been struggling with their health in a lot of ways, and connected with this, conflict between each other. It’s the thing that everybody’s talking about, but nobody’s talking about. I think formal support structures (counseling, therapy, psychiatry, mediation) can be intimidating or may seem inaccessible or can be really disconnected with one’s experience, but at the same time they can create a space to start dealing in a way that one can’t create for themselves, or their peers. Is there some kind of middle ground, between being on one’s own and these more formal institutions? Also, is there a structured way to support folks who are dealing with things that sit in a grey area between mental health, relationship health, physical health, and more?
Sprickets, The Gigggles, Big Black Cloud, Eric Radoux @ WIUX Stationhouse. 8p.
BASILICA, Harlots + more TBA @ Rhino’s. 8p. $5.
BASILICA, Harlots, and more.

Wild, ecstatic music for dueling violins, heart-wrenching vocals, searing
guitar and fragmented drums.